转自:https://medium.com/netflix-techblog/java-in-flames-e763b3d32166
Java mixed-mode flame graphs provide a complete visualization of CPU usage and have just been made possible by a new JDK option: -XX:+PreserveFramePointer
. We’ve been developing these at Netflix for everyday Java performance analysis as they can identify all CPU consumers and issues, including those that are hidden from other profilers.
Example
This shows CPU consumption by a Java process, both user- and kernel-level, during a vert.x benchmark:
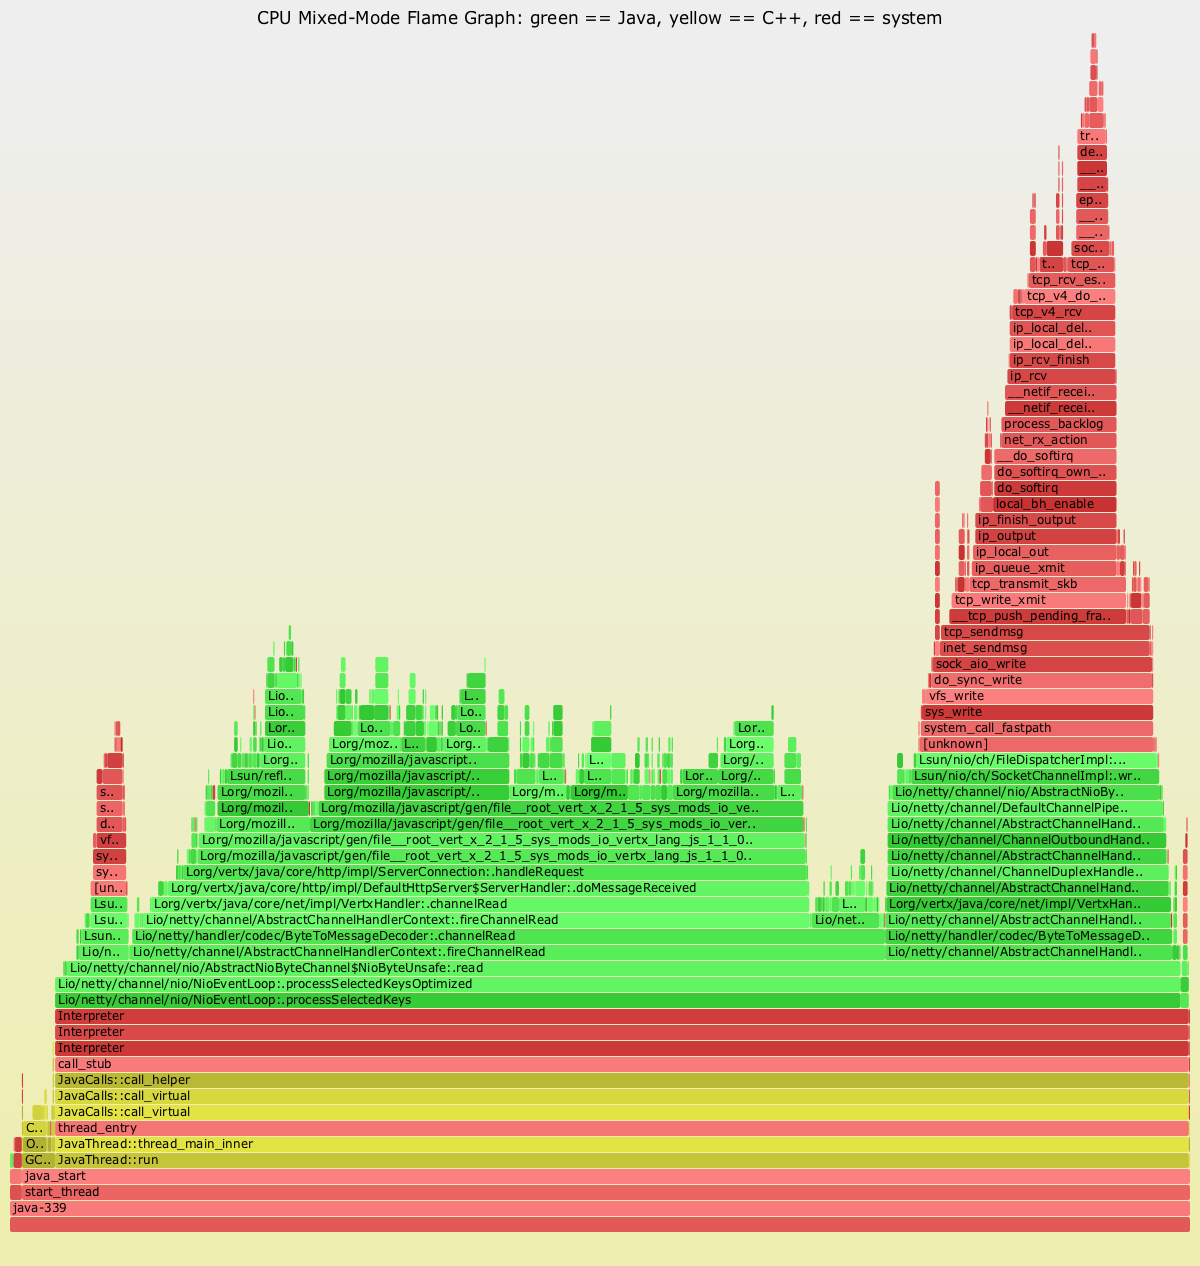
Showing all CPU usage with Java context is amazing and useful. On the top right you can see a peak of kernel code (colored red) for performing a TCP send (which often leads to a TCP receive while handling the send). Beneath it (colored green) is the Java code responsible. In the middle (colored green) is the Java code that is running on-CPU. And in the bottom left, a small yellow tower shows CPU time spent in GC. We’ve already used Java flame graphs to quantify performance improvements between frameworks (Tomcat vs rxNetty), which included identifying time spent in Java code compilation, the Java code cache, other system libraries, and differences in kernel code execution. All of these CPU consumers were invisible to other Java profilers, which only focus on the execution of Java methods.
Flame Graph Interpretation
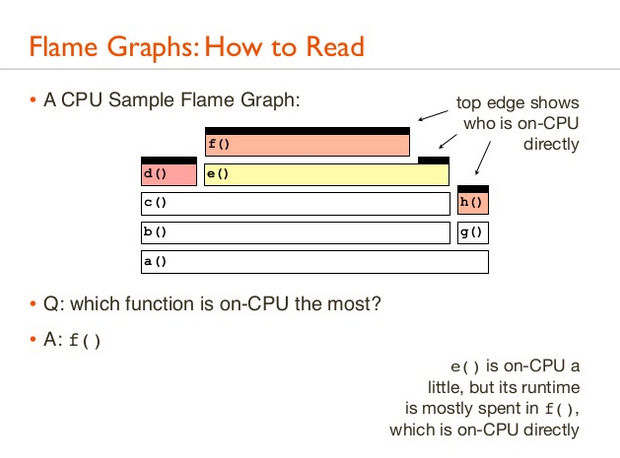
If you are new to flame graphs: The y axis is stack depth, and the x axis spans the sample population. Each rectangle is a stack frame (a function), where the width shows how often it was present in the profile. The ordering from left to right is unimportant (the stacks are sorted alphabetically). In the previous example, color hue was used to highlight different code types: green for Java, yellow for C++, and red for system. Color intensity was simply randomized to differentiate frames (other color schemes are possible).
You can read the flame graph from the bottom up, which follows the flow of code from parent to child functions. Another way is top down, as the top edge shows the function running on CPU, and beneath it is its ancestry. Focus on the widest functions, which were present in the profile the most. See the CPU flame graphs page for more about interpretation, and Brendan’sUSENIX/LISA’13 talk (video):
The Problem with Profilers
In order to generate flame graphs, you need a profiler that can sample stack traces. There have historically been two types of profilers used on Java:
System profilers: such as Linux perf_events, which can profile system code paths, including libjvm internals, GC, and the kernel, but not Java methods.
JVM profilers: such as hprof, Lightweight Java Profiler (LJP), and commercial profilers. These show Java methods, but not system code paths.
To understand all types of CPU consumers, we previously used both types of profilers, creating a flame graph for each. This worked — sort of. While all CPU consumers could be seen, Java methods were missing from the system profile, which was crucial context we needed. Ideally, we would have one flame graph that shows it all: system and Java code together.
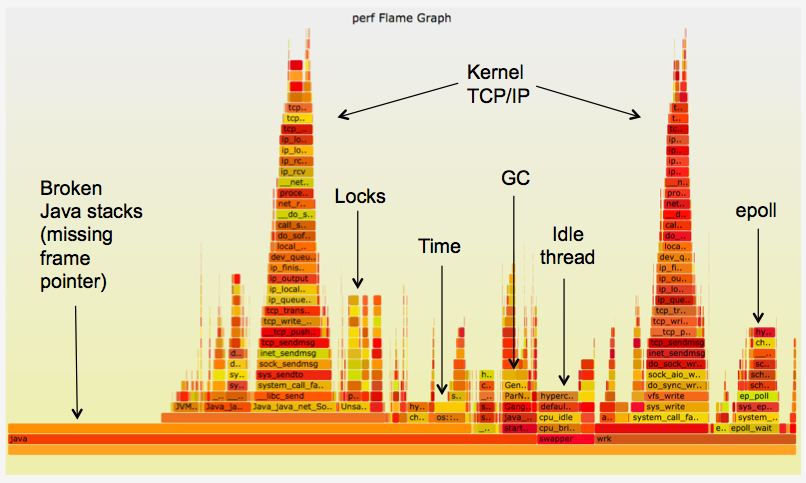
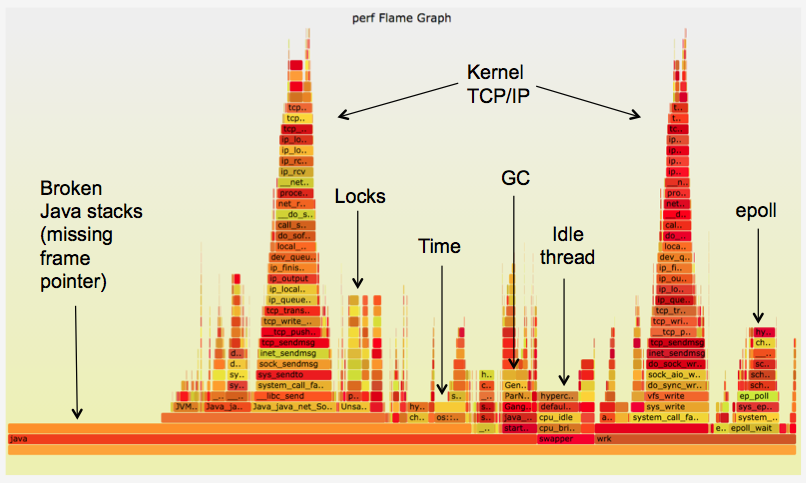
A system profiler like Linux perf_events should be well suited to this task as it can interrupt any software asynchronously and capture both user- and kernel-level stacks. However, system profilers don’t work well with Java. The problem is shown by the flame graph on the right. The Java stacks and method names are missing. There were two specific problems to solve:
The JVM compiles methods on the fly (just-in-time: JIT), and doesn’t expose a symbol table for system profilers.
The JVM also uses the frame pointer register on x86 (RBP on x86–64) as a general-purpose register, breaking traditional stack walking.
Brendan summarized these earlier this year in his Linux Profiling at Netflixtalk for SCALE. Fortunately, there was already a fix for the first problem.
SCALE13x: Linux Profiling at NetflixAt the Southern California Linux Expo ( SCALE 13x) last weekend, I gave a talk on Linux Profiling at Netflix using…www.brendangregg.com
Fixing Symbols
In 2009, Linux perf_events added JIT symbol support, so that symbols from language virtual machines like the JVM could be inspected. To use it, your application creates a /tmp/perf-PID.map text file, which lists symbol addresses (in hex), sizes, and symbol names. perf_events looks for this file by default and, if found, uses it for symbol translations.
Java can create this file using perf-map-agent, an open source JVMTI agent written by Johannes Rudolph. The first version needed to be attached on Java startup, but Johannes enhanced it to attach later on demand and take a symbol dump. That way, we only load it if we need it for a profile. Thanks, Johannes!
Since symbols can change slightly during the profile (we’re typically profiling for 30 or 60 seconds), a symbol dump may include stale symbols. We’ve looked at taking two symbol dumps, before and after the profile, to highlight any such differences. Another approach in development involves a timestamped symbol log to ensure that all translations are accurate (although this requires always-on logging of symbols). So far symbol churn hasn’t been a large problem for us, after Java and JIT have “warmed up” and symbol churn is minimal (this can take a few minutes, given sufficient load). We do bear it in mind when interpreting flame graphs.
Fixing Frame Pointers
For many years the gcc compiler has reused the frame pointer as a compiler optimization, breaking stack traces. Some applications compile with the gcc option -fno-omit-frame-pointer, to preserve this type of stack walking, however, the JVM had no equivalent option. Could the JVM be modified to support this? Brendan was curious to find out, and hacked a working prototype for OpenJDK. It involved dropping RBP from eligible register pools, eg (diff):
--- openjdk8clean/hotspot/src/cpu/x86/vm/x86_64.ad 2014-03-04 02:52:11.000000000 +0000+++ openjdk8/hotspot/src/cpu/x86/vm/x86_64.ad 2014-11-08 01:10:49.686044933 +0000@@ -166,10 +166,9 @@// 3) reg_class stack_slots( /* one chunk of stack-based "registers" */ )//-// Class for all pointer registers (including RSP)+// Class for all pointer registers (including RSP, excluding RBP)reg_class any_reg(RAX, RAX_H,RDX, RDX_H,- RBP, RBP_H,RDI, RDI_H,RSI, RSI_H,RCX, RCX_H,
… and then fixing the function prologues to store the stack pointer (rsp) into the frame pointer (base pointer) register (rbp):
--- openjdk8clean/hotspot/src/cpu/x86/vm/macroAssembler_x86.cpp 2014-03-04 02:52:11.000000000 +0000+++ openjdk8/hotspot/src/cpu/x86/vm/macroAssembler_x86.cpp 2014-11-07 23:57:11.589593723 +0000@@ -5236,6 +5236,7 @@// We always push rbp, so that on return to interpreter rbp, will be// restored correctly and we can correct the stack.push(rbp);+ mov(rbp, rsp);// Remove word for ebpframesize -= wordSize;
It worked. Here are the before and after flame graphs. Brendan posted it, with example flame graphs, to the hotspot compiler devs mailing list. This feature request became JDK-8068945 for JDK9 and JDK-8072465 for JDK8.
Fixing this properly involved a lot more work (see discussions in the bugs and mailing list). Zoltán Majó, of Oracle, took this on and rewrote the patch. After testing, it was finally integrated into the early access releases of bothJDK9 and JDK8 (JDK8 update 60 build 19), as the new JDK option: -XX:+PreserveFramePointer
.
Many thanks to Zoltán, Oracle, and the other engineers who helped get this done!
Since use of this mode disables a compiler optimization, it does decrease performance slightly. We’ve found in tests that this costs between 0 and 3% extra CPU, depending on the workload. See JDK-8068945 for some additional benchmarking details. There are also other techniques for walking stacks, some with zero run time cost to make available, however, there are other downsides with these approaches.
[JDK-8068945] Use RBP register as proper frame pointer in JIT compiled code on x86 - Java Bug…We used rbp register for local values in jit compiled code on x86 because 32-bit mode have only few registers. We do…bugs.openjdk.java.net
Instructions
The following steps describe how these flame graphs can be created. We’re working on improving and automating these steps using Vector (more on that in a moment).
- Install software
There are four components to install:
Linux perf_events
This is the standard Linux profiler, aka “perf” after its front end, and is included in the Linux source (tools/perf). Try running perf help
to see if it is installed; if not, your distro may suggest how to get it, usually by adding a perf-tools-common package.
Java 8 update 60 build 19 (or newer)
This includes the frame pointer patch fix (JDK-8072465), which is necessary for Java stack profiling. It is currently released as early access (built from OpenJDK).
perf-map-agent
This is a JVMTI agent that provides Java symbol translation for perf_events is on github. Steps to build this typically involve:
apt-get install cmakeexport JAVA_HOME=/path-to-your-new-jdk8git clone --depth=1 https://github.com/jrudolph/perf-map-agentcd perf-map-agentcmake .make
The current version of perf-map-agent can be loaded on demand, after Java is running. WARNING: perf-map-agent is experimental code — use at your own risk, and test before use!
FlameGraph
This is some Perl software for generating flame graphs. It can be fetched from github:
git clone --depth=1 https://github.com/brendangregg/FlameGraph
This contains stackcollapse-perf.pl, for processing perf_events profiles, and flamegraph.pl, for generating the SVG flame graph. - Configure Java
Java needs to be running with the -XX:+PreserveFramePointer
option, so that perf_events can perform frame pointer stack walks. As mentioned earlier, this can cost some performance, between 0 and 3% depending on the workload.
3a. Generate System Wide Flame Graphs
With this software and Java running with frame pointers, we can profile and generate flame graphs. For example, taking a 30-second profile at 99 Hertz (samples per second) of all processes, then caching symbols for Java PID 1690, then generating a flame graph:
sudo perf record -F 99 -a -g -- sleep 30java -cp attach-main.jar:$JAVA_HOME/lib/tools.jar net.virtualvoid.perf.AttachOnce 1690 # run as same user as javasudo chown root /tmp/perf-*.mapsudo perf script | stackcollapse-perf.pl | \flamegraph.pl --color=java --hash > flamegraph.svg
The attach-main.jar file is from perf-map-agent, and stackcollapse-perf.pl and flamegraph.pl are from FlameGraph. Specify their full paths unless they are in the current directory.
These steps address some quirky behavior involving user permissions: sudo perf script only reads symbol files the current user (root) owns, and, perf-map-agent creates files with the same user ownership as the Java process, which for us is usually non-root. This means we have to change the ownership to root for the symbol file, and then run perf script.
With jmaps
Dealing with symbol files has become a chore, so we’ve been automating it. Here’s one example: jmaps, which can be used like so:
sudo perf record -F 99 -a -g -- sleep 30; sudo jmapssudo perf script | stackcollapse-perf.pl | \flamegraph.pl --color=java --hash > flamegraph.svg
jmaps creates symbol files for all Java processes, with root ownership. You may want to write a similar “jmaps” helper for your environment (our jmaps example is unsupported). Remember to clean up the /tmp symbol files when you no longer need them!
3b. Generate By-Process Flame Graphs
The previous procedure grouped Java processes together. If it is important to separate them (and, on some of our instances, it is), you can modify the procedure to generate a by-process flame graph. Eg (with jmaps):
sudo perf record -F 99 -a -g -- sleep 30; sudo jmapssudo perf script -f comm,pid,tid,cpu,time,event,ip,sym,dso,trace | \stackcollapse-perf.pl --pid | \flamegraph.pl --color=java --hash > flamegraph.svg
The output of stackcollapse-perf.pl formats each stack as a single line, and is great food for grep/sed/awk. For the flamegraph at the top of this post, we used the above procedure, and added “| grep java-339” before the “| flamegraph.pl”, to isolate that one process. You could also use a “| grep -v cpu_idle”, to exclude the kernel idle threads.
Missing Frames
If you start using these flame graphs, you’ll notice that many Java frames (methods) are missing. Compared to the jstack(1) command line tool, the stacks seen in the flame graph look perhaps one third as deep, and are missing many frames. This is because of inlining, combined with this type of profiling (frame pointer based) which only captures the final executed code.
This hasn’t been much of a problem so far: even when many frames are missing, enough remain that we can figure out what’s going on. We’ve also experimented with reducing the amount of inlining, eg, using -XX:InlineSmallCode=500
, to increase the number of frames in the profile. In some cases this even improves performance slightly, as the final compiled instruction size is reduced, fitting better into the processor caches (we confirmed this using perf_events separately).
Another approach is to use JVMTI information to unfold the inlined symbols. perf-map-agent has a mode to do this; however, Min Zhou from LinkedIn has experienced Java crashes when using this, which he has been fixing in his version. We’ve not seen these crashes (as we rarely use that mode), but be warned.
Vector
The previous steps for generating flame graphs are a little tedious. As we expect these flame graphs will become an everyday tool for Java developers, we’ve looked at making them as easy as possible: a point-and-click interface. We’ve been prototyping this with our open source instance analysis tool: Vector.
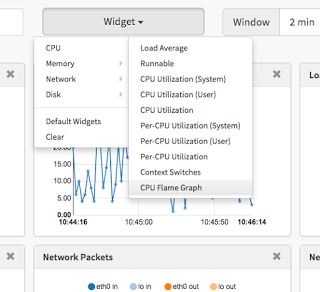
Vector was described in more details in a previous techblog post. It provides a simple way for users to visualize and analyze system and application-level metrics in near real-time, and flame graphs is a great addition to the set of functionalities it already provides.
Introducing VectorNetflix’s On-Host Performance Monitoring Toolmedium.com
We tried to keep the user interaction as simple as possible. To generate a flame graph, you connect Vector to the target instance, add the flame graph widget to the dashboard, then click the generate button. That’s it!
Behind the scenes, Vector requests a flame graph from a custom instance agent that we developed, which also supplies Vector’s other metrics. Vector checks the status of this request while fetching and displaying other metrics, and displays the flame graph when it is ready.
Our custom agent is not generic enough to be used by everyone yet (it depends on the Netflix environment), so we have yet to open-source it. If you’re interested in testing or extending it, reach out to us.
Future Work
We have some enhancements planned. One is for regression analysis, by automatically collecting flame graphs over different days and generating flame graph differentials for them. This will help us quickly understand changes in CPU usage due to software changes.
Apart from CPU profiling, perf_events can also trace user- and kernel-level events, including disk I/O, networking, scheduling, and memory allocation. When these are synchronously triggered by Java, a mixed-mode flame graph will show the code paths that led to these events. A page fault mixed-mode flame graph, for example, can be used to show which Java code paths led to an increase in main memory usage (RSS).
We also want to develop enhancements for flame graphs and Vector, including real time updates. For this to work, our agent will collect perf_events directly and return a data structure representing the partial flame graph to Vector with every check. Vector, with this information, will be able to assemble the flame graph in real time, while the profile is still being collected. We are also investigating using D3 for flame graphs, and adding interactivity improvements.
Other Work
Twitter have also explored making perf_events and Java work better together, which Kaushik Srenevasan summarized in his Tracing and Profiling talk from OSCON 2014 (slides).
Kaushik showed that perf_events has much lower overhead when compared to some other Java profilers, and included a mixed-mode stack trace from perf_events.
David Keenan from Twitter also described this work in his Twitter-Scale Computing talk (video), as well as summarizing other performance enhancements they have been making to the JVM.
At Google, Stephane Eranian has been working on perf_events and Java as well and has posted a patch series that supports a timestamped JIT symbol transaction log from Java for accurate symbol translation, solving the stale symbol problem. It’s impressive work, although a downside with the logging technique may be the performance cost of always logging symbols even if a profiler is never used.
Conclusion
CPU mixed-mode flame graphs help identify and quantify all CPU consumers. They show the CPU time spent in Java methods, system libraries, and the kernel, all in one visualization. This reveals CPU consumers that are invisible to other profilers, and have so far been used to identify issues and explain performance changes between software versions.
These mixed-mode flame graphs have been made possible by a new option in the JVM: -XX:+PreserveFramePointer, available in early access releases. In this post we described how these work, the challenges that were addressed, and provided instructions for their generation. Similar visibility for Node.js was described in our earlier post: Node.js in Flames:
Node.js in FlamesWe've been busy building our next-generation Netflix.com web application using Node.js. You can learn more about our…techblog.netflix.com
*by Brendan Gregg and *Martin Spier
Originally published at techblog.netflix.com on July 24, 2015.
